 |
|
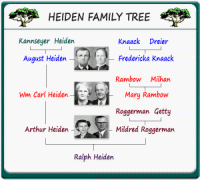 Some
of the best tools for presenting genealogy information include
family trees and graphic charts. There are many, many ways of
using these wonderful options and I have selected several
different types to include in this website. Some
of the best tools for presenting genealogy information include
family trees and graphic charts. There are many, many ways of
using these wonderful options and I have selected several
different types to include in this website.
This website was created by me,
Ralph Heiden, so the families included are all my relatives.
August and Rika (Knaack & Dreier) Heiden were my great
grandparents, William Carl and Mary (Rambow & Milhan) Heiden
were my grandparents and Arthur and Mildred (Roggerman & Getty)
Heiden my parents.
 |
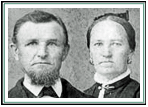 The
Heiden, Kanseyer, Knaack and Dreier families are
related to August and Fredericka Heiden and their
ancestors and descendents. The
Heiden, Kanseyer, Knaack and Dreier families are
related to August and Fredericka Heiden and their
ancestors and descendents. |
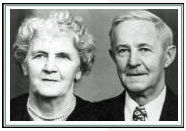 The
Rambow, Milhan and Möller families pertain to the
ancestors and descendants of Mary (Mrs Wm Carl)
Heiden. The
Rambow, Milhan and Möller families pertain to the
ancestors and descendants of Mary (Mrs Wm Carl)
Heiden. |
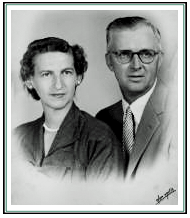 The
Roggerman and Getty families are the ancestors of
Mildred (Mrs Arthur) Heiden. The
Roggerman and Getty families are the ancestors of
Mildred (Mrs Arthur) Heiden. |
|
|
 |
As with anything in this
website, I would like to share these with other members of
the various families. I can create them to include any
combination of ancestors and, since the customized version
will not appear on the website, they can be extended
into living generations. All you would need to do is provide
me with the information and images to include.
The final product would be
sent to you in digital form and you can print it off if you
like. If you would like a copy of a chart made
specifically for you, I would be glad to work with you to
make it happen. Of course, there is no charge. Just send an
EMAIL.
There are seven different types of charts
and family trees and a list of statistics from the
RootsMagic genealogy software I use. Click on the topics
below for further information on each option.
|
|
|
|
 |
 |
|
 |
|
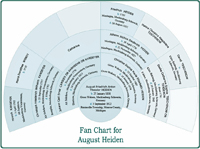  A
fan chart starts with the subject person in the center and then
radiates out revealing the ancestors of his or her parents and
grandparents and back into further generations. A
fan chart starts with the subject person in the center and then
radiates out revealing the ancestors of his or her parents and
grandparents and back into further generations.
These can be quite large
depending on the number of ancestral generations included. These
are made in the RootsMagic software. |
 |
|
 |
 |
|
 |
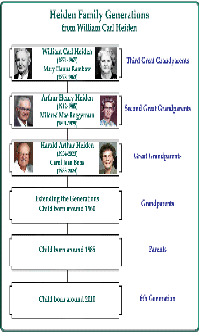
 
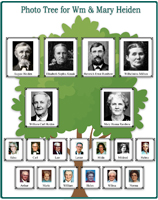
These charts are created in PhotoShop and include pictures of
the ancestors from each generation. The sample charts include
projected generations which can be filled in for living
generations that are not included in this website.
|
 |
|
 |
|
 |
|
 |
   |
 |
|
 |
|
 |
|
 |
   |
 |
|
 |
|
 |
|
 |
    |
 |
|
 |
|
 |
|
 |
|
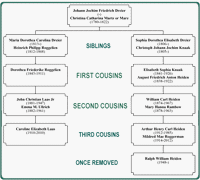
   Graphic Form - As the name implies, these are graphical
representations of the family tree. They include the key person
in each generation plus their spouse and his or her parents
family surnames. If you would like one of these graphics (.jpg
form) that is personalized to you or another member of your
family, I would be happy to provide it to you. Just send an
EMAIL. Graphic Form - As the name implies, these are graphical
representations of the family tree. They include the key person
in each generation plus their spouse and his or her parents
family surnames. If you would like one of these graphics (.jpg
form) that is personalized to you or another member of your
family, I would be happy to provide it to you. Just send an
EMAIL.
 |
|
|
|
 |
|
 |
|
 |
Text Based - These are charts that list each generation in
written form that include the key person in each generation plus
their children. They start with the earliest ancestor from
Germany or Ireland and then follows the branches down to the
early generations in America.
 |
 |
|
 |
|
 |
|
 |
   |
|
 |
|
 |
|
 |
|
 |
|
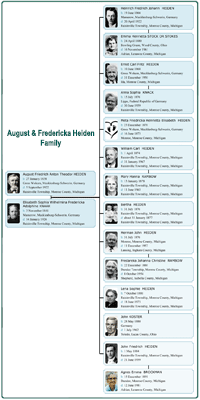
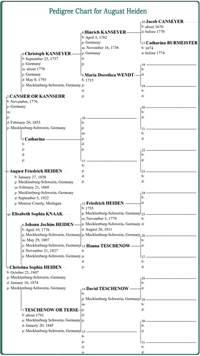
  As of 2024, we have
over 2,600 individuals entered into the RootsMagic
database. The software can organize the data in
many, many ways. We have included three examples
which are included in the database. (for Non-Living
relatives) As of 2024, we have
over 2,600 individuals entered into the RootsMagic
database. The software can organize the data in
many, many ways. We have included three examples
which are included in the database. (for Non-Living
relatives) |
|
 |
|
 |
|
 |
|
 |
   |
 |
|
 |
|
 |
|
 |
  |
 |
|
 |
|
 |
|
|
|
|
 |
|
|


